By Peter Huber, Investment Writer and Benoit Gille, Quantitative Developer
As the macroeconomic regime shifted in 2022, following a decade of cheap money and buoyant asset prices, global equities plummeted. In the face of rising bond yields, heightened geopolitical uncertainty and a looming recession, the S&P 500 lost 17.9% for the year. Despite a rebound in 2023, investors are concerned about sudden adverse fluctuations in asset prices. Recent high-profile bank collapses – despite the US banking industry’s record breaking profits of $80 billion in the first quarter of the year1 – has forced the US Federal Reserve to rethink its approach to monetary tightening, suggesting a persistently uncertain macroeconomic environment with investors less aided by forward guidance.
Asset class diversification is a popular approach for investors seeking downside protection for their portfolios. During normal market conditions, such an approach is usually sufficient to safeguard against drawdowns. However, as markets become global and interdependent, financial instruments once assumed to be uncorrelated are proving to be increasingly correlated. Periods characterized by heightened market volatility face the materialization of tail risks; market events which, although improbable, can significantly decrease the value of a portfolio. However, the effects of such events cannot normally be mitigated with simple asset class diversification. Instead adequate protection against tail risks demands bespoke tail risk strategies.
This blog describes how, using the SigTech quant technologies platform, you can hedge the risk of a position in the S&P 500 with a rolling options overlay strategy, trading put options in the underlying instrument. Options-based strategies are a popular approach to protecting a portfolio from tail risks. Whilst they can be a drag on the performance of some portfolios, reducing the impact of sharp and unexpected losses can, at least in part, compensate for such costs.
S&P 500 Reinvestment Strategy
Before we can fashion our rolling put overlay it is necessary to determine the historical performance of the S&P 500. This timeseries can easily be generated on the SigTech platform. The graph below maps the SPY ETF’s drawdown history between January 2006 and March 2023.
Drawdown Plot for S&P 500 ETF Reinvestment Strategy
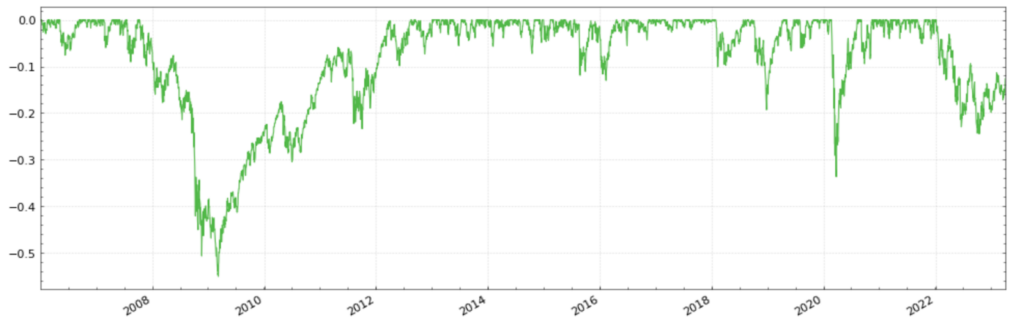
The S&P 500 index has two noticeable drawdown periods. The deepest drawdown occurred during the Global Financial Crisis. In the ensuing fallout, the strategy lost 55% of its value. The second drawdown of significance was the 2020 market shock induced by the Covid-19 pandemic. During this period the strategy lost roughly a third of its value.
These two episodes articulate the essential nature of tail risk (or black swan) events; rare, unexpected, and wholly unpredictable shocks to a portfolio with the potential to devastate its performance. Tail risk strategies seek to safeguard – or at least limit the impact on – portfolios from the damage inflicted by such events.
Rolling Put Option Overlay
In an attempt to reduce the potential impact from tail risk in this instance, we use a put option overlay. Utilizing SigTech’s rolling option strategy building block we construct a rolling overlay strategy, trading S&P 500 put options with an expiration date three months out. Our overlay rolls monthly, automatically closing out all of our positions on the roll dates. We set the strike price to 8.5% below the prevailing S&P 500 index value.
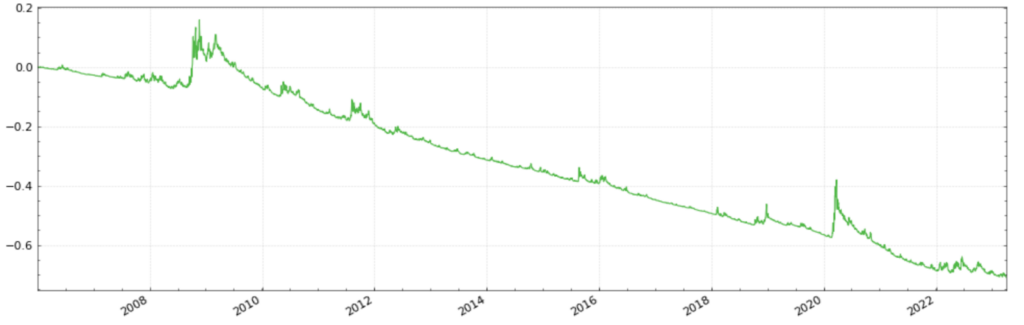
Plotting the history of this strategy between January 2006 and March 2023 reveals the following performance. The option strategy rose over 10% at the same time the S&P 500 suffered its deepest drawdown. The negative effects of Covid-19 on the S&P 500 also corresponds to a sharp rise in our put overlay.
Performance of Option Overlay
SigTech’s rich range of functionalities allows users to investigate the individual positions held and trades made throughout the life of a strategy.
Hedged Equity Strategy
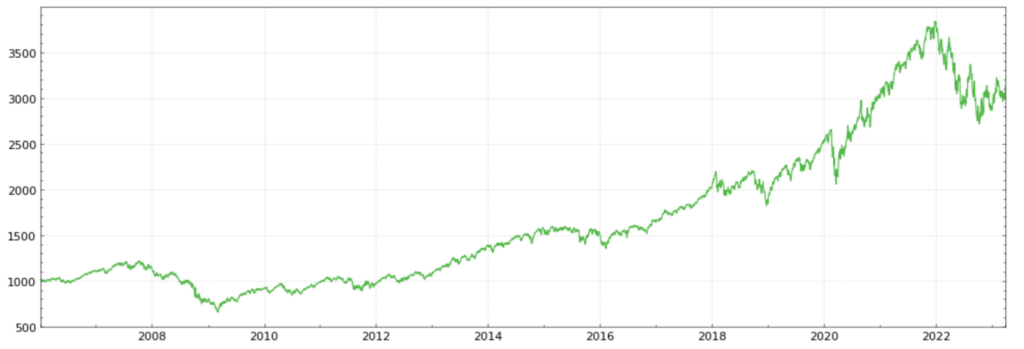
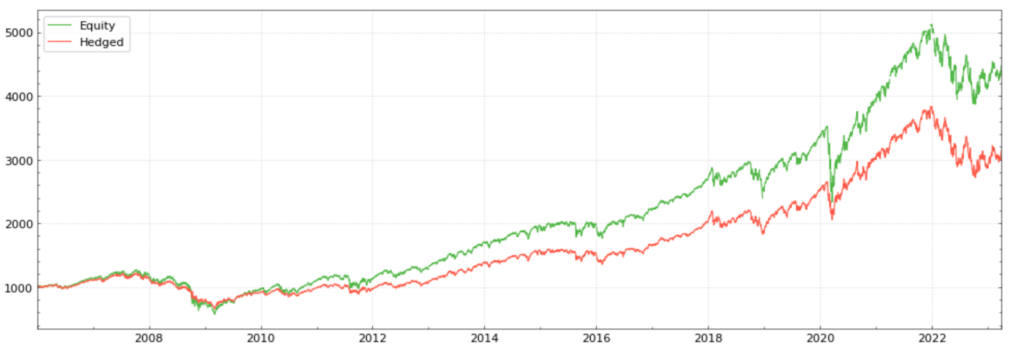
Using the signal strategy building block, we combine our single stock and rolling options strategy into a single hedged equity strategy. The performance of our hedged strategy is plotted below.
Performance of Combined S&P 500 and Options Overlay
We can compare the daily PnL contributions of all three strategies (equity reinvestment, rolling option, hedged equity). Whilst the backtest reveals drawdowns in both 2009 and 2020 for our hedged strategy, it is necessary to determine how these sell-offs differ in extremity from our unhedged S&P 500 reinvestment strategy. Furthermore, it is necessary to quantify the cost of the hedge.
Daily PnL Contributions

A tabulated breakdown of their respective performance can be generated using SigTech’s Performance Report functionality. These numbers confirm what we see in the time series plots. Whilst annualized excess returns fall from 9.1% for our S&P 500 reinvestment strategy to 6.9% for our hedged strategy, the extent of the drawdowns are reduced and the overall risk of the strategy (as measured by both annualized standard deviation and kurtosis2) is significantly reduced. Standard deviation falls from 19.9% to 15.5% and kurtosis falls from 14.0 to 9.9.
Performance Comparison – S&P 500 vs S&P 500 with Options Overlay
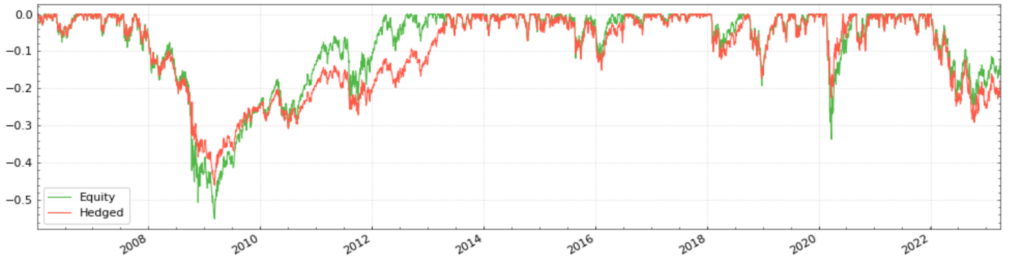
Plotting the drawdown history of the two strategies reveals that the losses endured during the GFC and Covd-19 periods are reduced by our options overlay. Indeed, the maximum drawdown in 2009 was cut from -55% to -46%. During the 2020 Covid drawdown, the option overlay cut losses from -33.7% to –22.5%. Yet, it is worth recognizing that the trade-off necessary for securing a 9% drawdown reduction in 2009 and an 11% drawdown reduction in 2020 is a 2.2% cut in annual returns over the entire backtesting period.
Drawdown Comparison – S&P 500 vs S&P 500 with Options Overlay
Tail Risk Hedging with SigTech
Effective forward planning is essential for successful tail risk management. By the time a black swan event occurs, it may be too late to meaningfully respond. Yet, ultimately a trade-off must occur between the performance of a strategy and the cost of hedging against tail risk using options. Whilst buying put options can safeguard a strategy against sharp and sudden losses, the cost of paying the option premiums can erode the overall value of a portfolio. However, mitigating the severity of drawdowns provides investors with the flexibility to respond anti-cyclically during times of market turmoil. This allows for the reallocation of investments to assets whose performance expectations have improved in the face of such turmoil. The SigTech platform offers an extensive range of options data for equity indices, commodities, FX, and swaps (swaptions) alongside the necessary functionality to, among other things, plot volatility surfaces, build customized options, and tabulate Greeks.
1 Gandel, S. (2023) US banks generated record $80bn first-quarter profits despite turmoil, FT.
2 Kurtosis measures the tailedness of a distribution – or the fatness of its tails. The higher a distribution’s kurtosis, the more likely tail risks are to materialize.