
Written by Peter Huber, Investment Writer & Stuart Broadfoot, VP Engineering
In an age of big data, the need for powerful analytical tools becomes increasingly important when seeking to identify the patterns and signals necessary for making informed investment decisions. Greater insight ultimately provides competitive advantages. SigTech’s Alpha Report1 is an interactive tool allowing users to apply an extensive range of analytical methods to their systematic investment strategies and datasets. This facilitates the rapid identification of meaningful relationships between variables and the potential trading signals embedded within those relationships, as well as the analysis of their predictive value with respect to future returns. Furthermore, it can reduce the risk of overfitting via the imposition of customizable limits on the available models. Employed during the initial research phase of the systematic investment process, the Alpha Report can greatly aid in the generation of strategy ideas. This blog outlines the analytical functionalities available within the Alpha Report, offering an overview of what they do and when they are appropriate to use.
Alpha Report Overview
The available plots and tools are divided into six themes of analysis:
- Distributions
Distributions investigate synchronous relationships between variables. They are suitable for gaining a quick understanding of patterns in the data and identifying possible hedging relationships. A selection of both temporal and metric views are available.
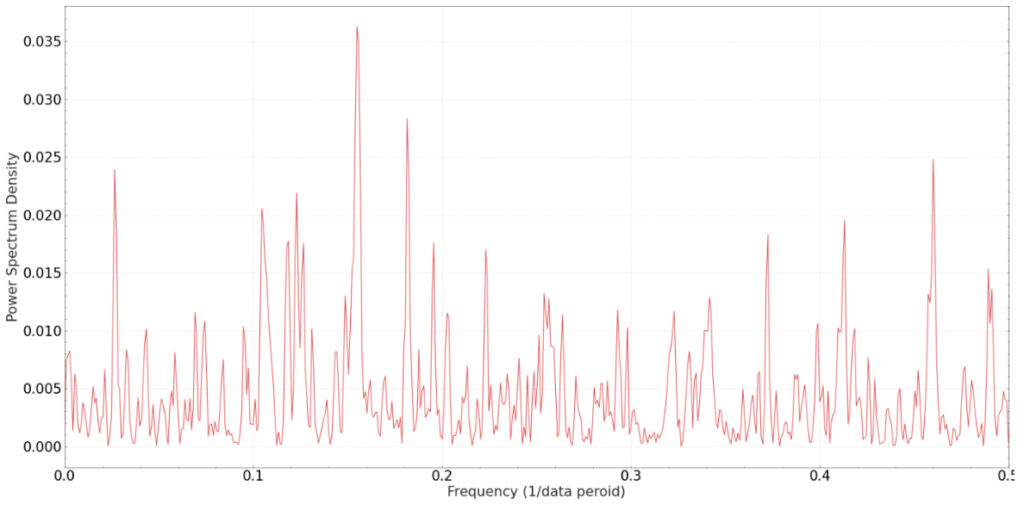
- Temporal
Temporal analysis identifies relationships existing across time. It is ideal for revealing the predictive capabilities of features (i.e. independent variables) and identifying price patterns (e.g. momentum). Available temporal models include time series, periodogram (see Figure (1)), stationarity, autocorrelation, Hurst exponents, dependency, Granger causality, group dependency, density, and cointegration.
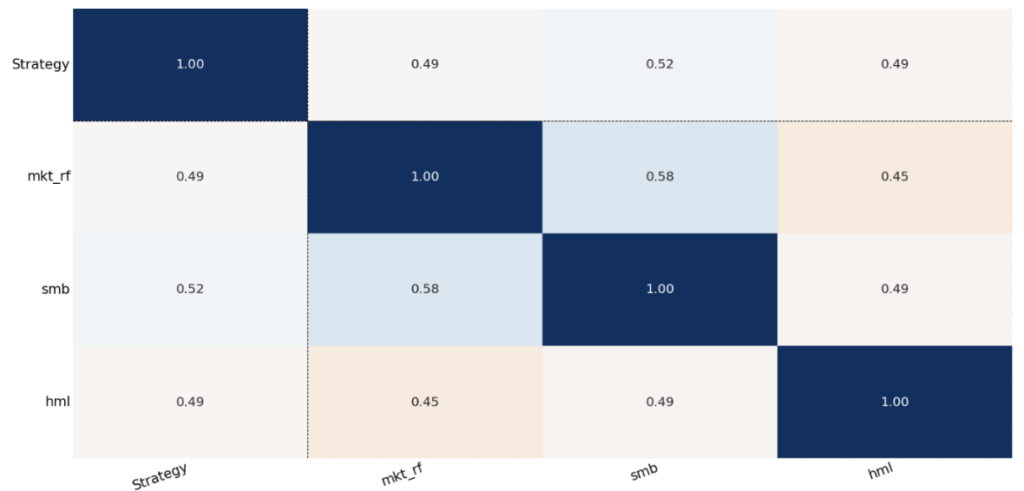
3. Metrics
Metrics are used for quantifying simple bipartite relationships in data via a range of both linear and non-linear dependency measures. They are ideal for identifying important variables and selecting features for further analysis. Available metrics include metric grids (see Figure (2)), rolling metrics, and downsampling.
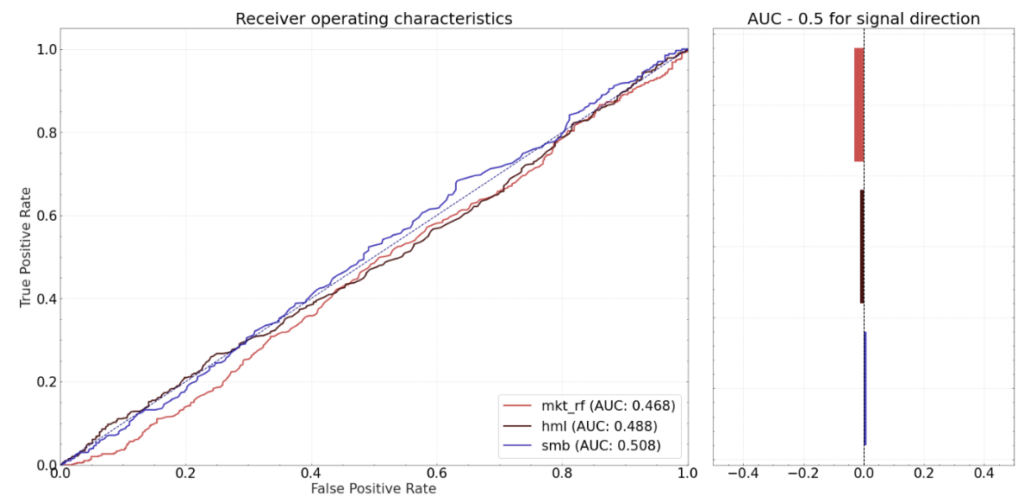
4. Classification
Classification is used to investigate the relationship between data split according to different thresholds. Forms of classification include confusion matrices and ROC curves (see Figure (3)).
5. Clustering
Clustering helps to discern groupings in data in order to reduce the size of a problem and avoid multicollinearity. The forms of clustering available within the Alpha Report are principal component analysis (PCA), network analysis, and the dendrogram.
6. Machine Learning
These functionalities can be used to train simple predictive models. They include regression, decision tree, and neural network models.
Data sourcing, management and analysis with SigTech
The Alpha Report is an example of the analytical depth available on the SigTech platform and the opportunities for statistical insight. Data and analytics are essential components of today’s investment management industry. Whether in the form of traditional financial markets data or alternative data sources like social media discourse, access to and analysis of these data sets is indispensable when seeking to discern patterns and signals to guide the investment process. Consequently, investment and portfolio managers are increasingly systematizing their analysis and investment processes.
Disclaimer
This content is not, and should not be construed as financial advice or an invitation to purchase financial products. It is provided for information purposes only and is subject to the terms and conditions of our disclaimer which can be accessed here.
References
1 Here, alpha refers to models capable of predicting returns.