As the investment management industry continues its quantitative shift, the role of data becomes increasingly central in the identification of profitable trading signals, potentiating its historical role and value. Yet, as both supply of and demand for data increases so too does the effort required to ensure it is clean and reliable. It cannot be assumed that the raw data available will be free from errors. Rather, it should be assumed that inaccuracies are replete throughout many datasets. To avoid the monotony and complexities of data cleaning and enable greater focus on the activities of research and portfolio management, a structured data validation process is required.
Common Errors in Financial Markets Data
There are a broad range of common errors that can adversely affect a dataset, its analysis, and the investment decisions it informs. These anomalies can exert varying degrees of influence on an investment strategy’s expected risk/return profile. Any datasets used for research should be subjected to a comprehensive data validation process. The following methodologies provide a glimpse of some of the processes employed on the SigTech quant technologies platform and our data validation engine (DaVe):
- Missing Values – instances where no value is recorded for a datapoint despite a trading calendar indicating a value should exist for that specific date. Such errors can reduce the statistical significance of an analysis leading to incorrect conclusions being drawn from research.
When validating the datasets on the SigTech platform, DaVe can forward fill such gaps, using the previous data point’s value. The method of replacement can be customized to the user’s preference.
- Stale Values – values in a time series representing a value for a previous point in time. An inaccurate reflection of reality based on the replication of old data. SigTech flags possible stale values. Such errors are generally remedied by requesting replacement data from the vendor or finding an alternative data source.
- Large Gaps – large patches of five consecutive data points or more of missing data within a dataset. Depending on the dataset in question, this is generally remedied by requesting replacement data from the vendor or finding an alternative data source.
- Unexpected Values – ensure that your data matches your trading calendar so that values only occur and orders are only executed on the correct trading days.
- Z Score – the number of standard deviations a value diverges from a known mean. Allows you to identify extreme outliers in a distribution. SigTech flags values exceeding a customizable number of standard deviations for further investigation. These checks can be applied on a rolling window, expanding window, absolute values, and percentage changes.
- Percentage Change – the difference between estimated value and actual value relative to the actual value (expressed as a percentage). SigTech flags values outside a customizable range for further investigation.
- Value in Range – an error arising from a value being outside of the accepted range for a function (e.g. a bond price between $90-110). SigTech flags values outside a customizable range for further investigation.
- Interquartile Range Check – determines the spread of data points within the middle half of a distribution to determine variability in a skewed dataset. SigTech flags variance outside of a customizable range for further investigation.
- Absolute Change – the difference between an expected (or measured) value and an actual value. SigTech flags values outside a customizable range for further investigation.
- Leading Zeros – common in back month futures contracts, datasets starting with 0s (in first row(s) or column(s)). Zero values or NaNs can be unreadable to some programming languages. This subsequently distorts analysis. SigTech removes these values from a dataset.
- No Null – instance where a value is missing from a dataset irrespective of the trading calendar. The presence of a null value can potentially break a systematic strategy’s code. SigTech imposes a constraint to prevent a data field from accepting null or missing values.
SigTech ensures that data on our quant technology platform has been validated before it is made available to users. DaVe allows both data producers and data users (i.e. researchers, portfolio managers, data scientists) to validate their datasets by customizing the thresholds for error detection and subsequent cleaning.
Comparing Clean and Dirty Data
To demonstrate the importance of data validation, the following example considers how four superficial yet common data errors can significantly impact a bond futures carry strategy.
A carry strategy seeks to exploit the difference between the yield on two financial instruments with differing maturities. The strategy utilizes one of SigTech’s pre-built and fully customizable building blocks; the Rolling Future Strategy. It trades four futures contracts, taking long and short positions for each instrument for the top and bottom 25% of signal values, maintaining 100% gross exposure. Contracts traded are:
- US 10Y T-Note futures
- US Long bond futures
- US 2Y T-Note futures
- US 5Y T-Note futures
To illustrate the impact of erroneous data points, we synthetically add data errors to each of the datasets. These mimic errors commonly found in financial data.
Misplaced Decimals
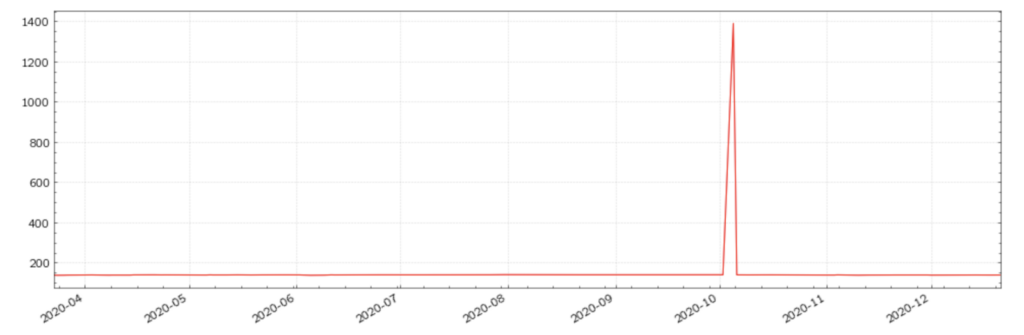
The first error arises frequently in financial markets data and can have extraordinary repercussions for traders; misplaced decimal points. They often arise as a consequence of manual data entry, which remains a common industry practice.
Figure (1): US 10Y T-Note futures with a misplaced decimal for a single data point
For a visual comparison, the clean time series is included below.
Figure (2): US 10Y T-Note futures with a clean dataset
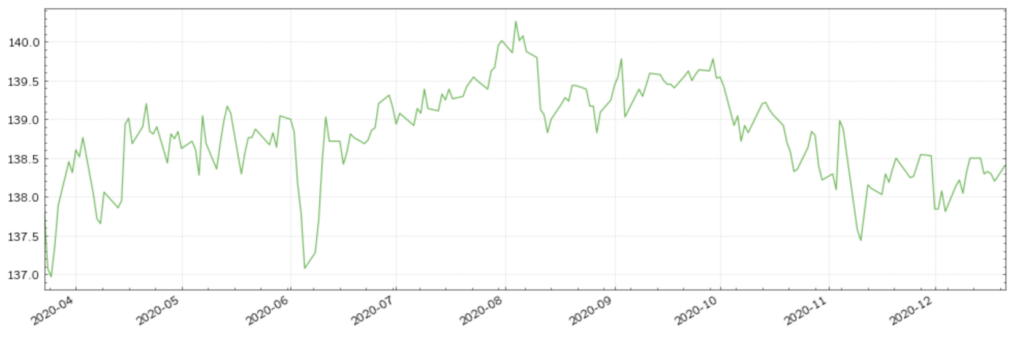
Misplaced decimals disrupt the plotted time series to an extent that is easily recognisable as an anomaly. However, when building a strategy, researchers and portfolio managers may not always choose to visually display the data being used, due to either the inefficiency arising from plotting multiple datasets or the assumption that the data will be clean. However, even if a researcher chooses to plot all of the datasets, some errors will not generate discernible disruptions, complicating their visual detection.
Values out of Range
Another common error in financial markets data are data points with values deviating from an accepted range. Deviations can vary widely. Whilst large deviations will have a greater impact on analysis, they are generally easier to identify. Below are two versions of the US 5Y T-Note futures time series; the first with an incorrect value, the second without.
Figure (3): US 5Y T-Note futures with an incorrect value
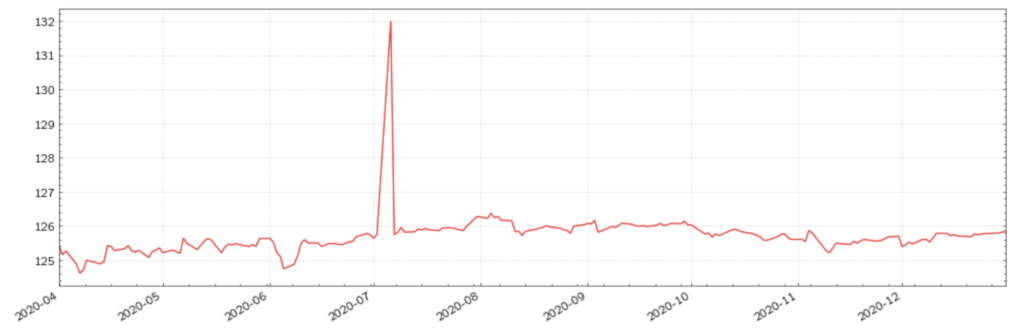
Figure (4): US 5Y T-Note futures with a clean dataset
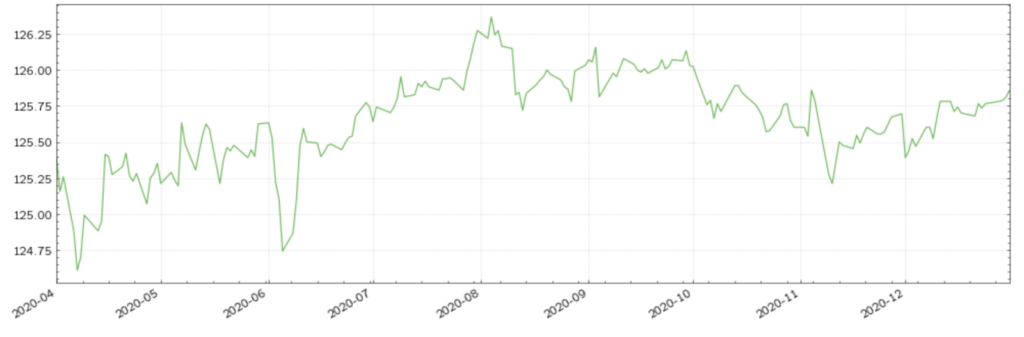
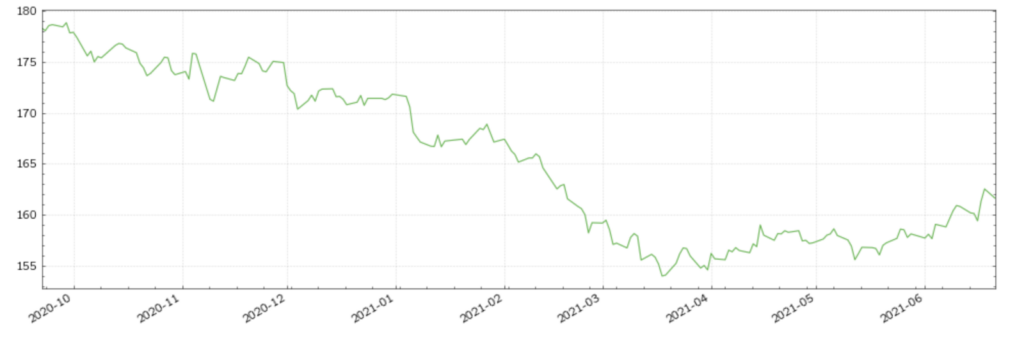
Stale Values
The third error is also commonplace and can be easily overlooked; stale values. In the US Long Bond futures time series below we have randomly added stale values to 10 days across the time series. The first plot includes the stale values, whilst the second plot represents the clean time series. As is clear from their comparison, these errors are much more difficult to identify visually.
Figure (5): US Long Bond futures with stale values for March 2017
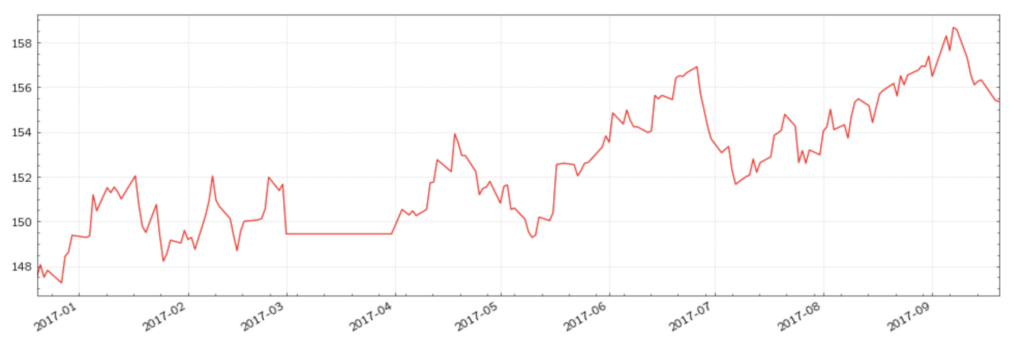
Figure (6): US Long Bond futures with a clean dataset
Overall Strategy Performance
Backtesting our carry strategy using the errored datasets results in an annualized excess return of 2.5%, a Sharpe ratio of 0.3 and a maximum drawdown of -6.6%.
Figure (7): Bond Carry Strategy with corrupted datasets
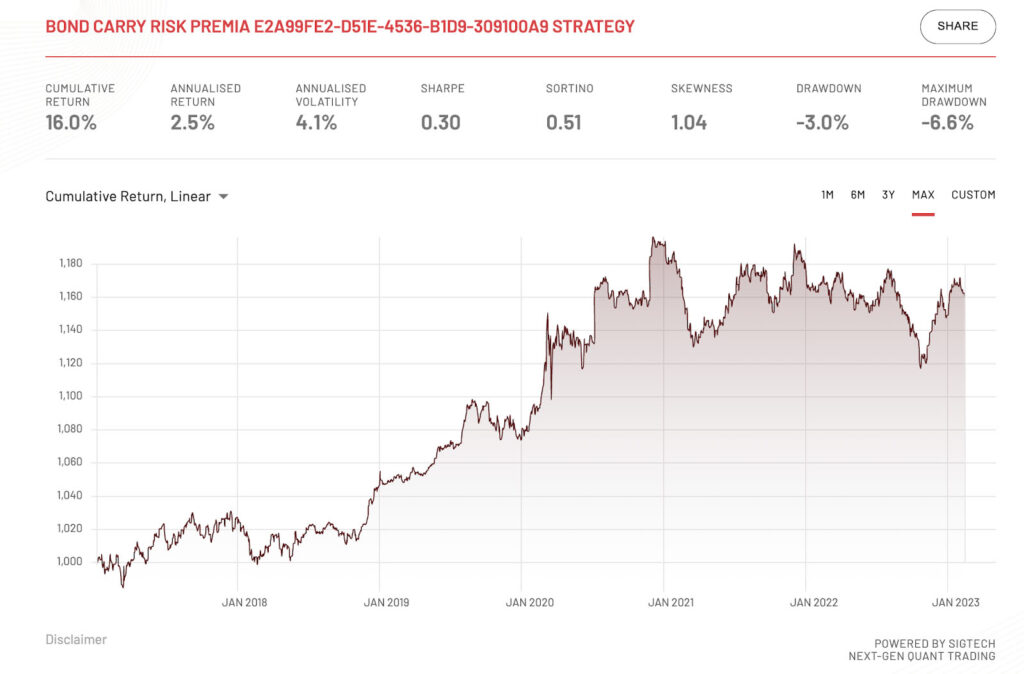
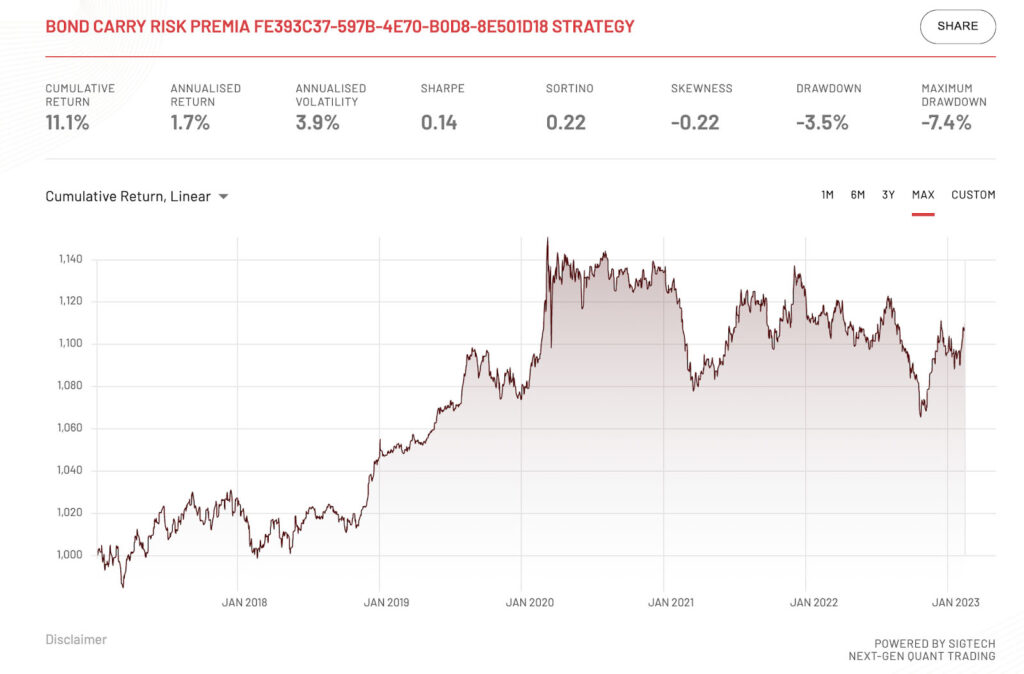
When backtesting using clean datasets, the results suggest a riskier, less profitable strategy. Annualized returns fall to 1.7%, the Sharpe ratio dips to 0.14, and the maximum drawdown is -7.4%. Thus, in the presence of the anomalies, investors may have been enticed into taking an uninformed investment decision.
Figure (8): Bond Carry Strategy with clean datasets
Conclusion
This blog has demonstrated the significance data errors can have in the construction of investment strategies. Without accurate and reliable data, investment decisions are subject to distorted risk and return expectations. The SigTech platform provides investment managers with a wide range of quant technologies and analytical tools, supported by a rich pool of financial markets data. This data has been pre-validated and fully operationalized via DaVe, allowing users to focus on research and portfolio management without the added burden of data management. DaVe allows users to customize their own validation parameters and efficiently clean their own data.
Disclaimer
This content is not, and should not be construed as financial advice or an invitation to purchase financial products. It is provided for information purposes only and is subject to the terms and conditions of our disclaimer which can be accessed here.